nPlan Insights Pro and nPlan Portfolio now integrate with Power BI
Two new nTegrations mean you can turn your Power BI set-up from a static reporting tool into a proactive decision-support system

Traditional Power BI dashboards are powerful - but they’re often backward-looking, focused on what has already happened. They show the lagging indicators of performance rather than the leading indicators of risk.
That’s where nPlan comes in.
With the new Power BI integration for nPlan Insights Pro and Portfolio, project teams can pipe the forecasts and risk insights generated by nPlan's AI directly into Power BI. This transforms it from a static reporting tool into a proactive decision-support system — one that helps teams visualise predicted delays, emerging risks, and uncertainty ranges before they impact delivery.
By combining nPlan’s predictive assurance with Power BI’s flexible analytics environment, organisations can spot and tackle risks earlier, communicate more clearly, and keep projects on track.
Read on for more on why we built this integration - and how we believe it'll help our users👇
1. Welcome to your 'living assurance dashboard'
nPlan’s AI is trained on over 750,000 past project schedules and forecasts activity and milestone outcomes with an accuracy which human operators are unable to match.
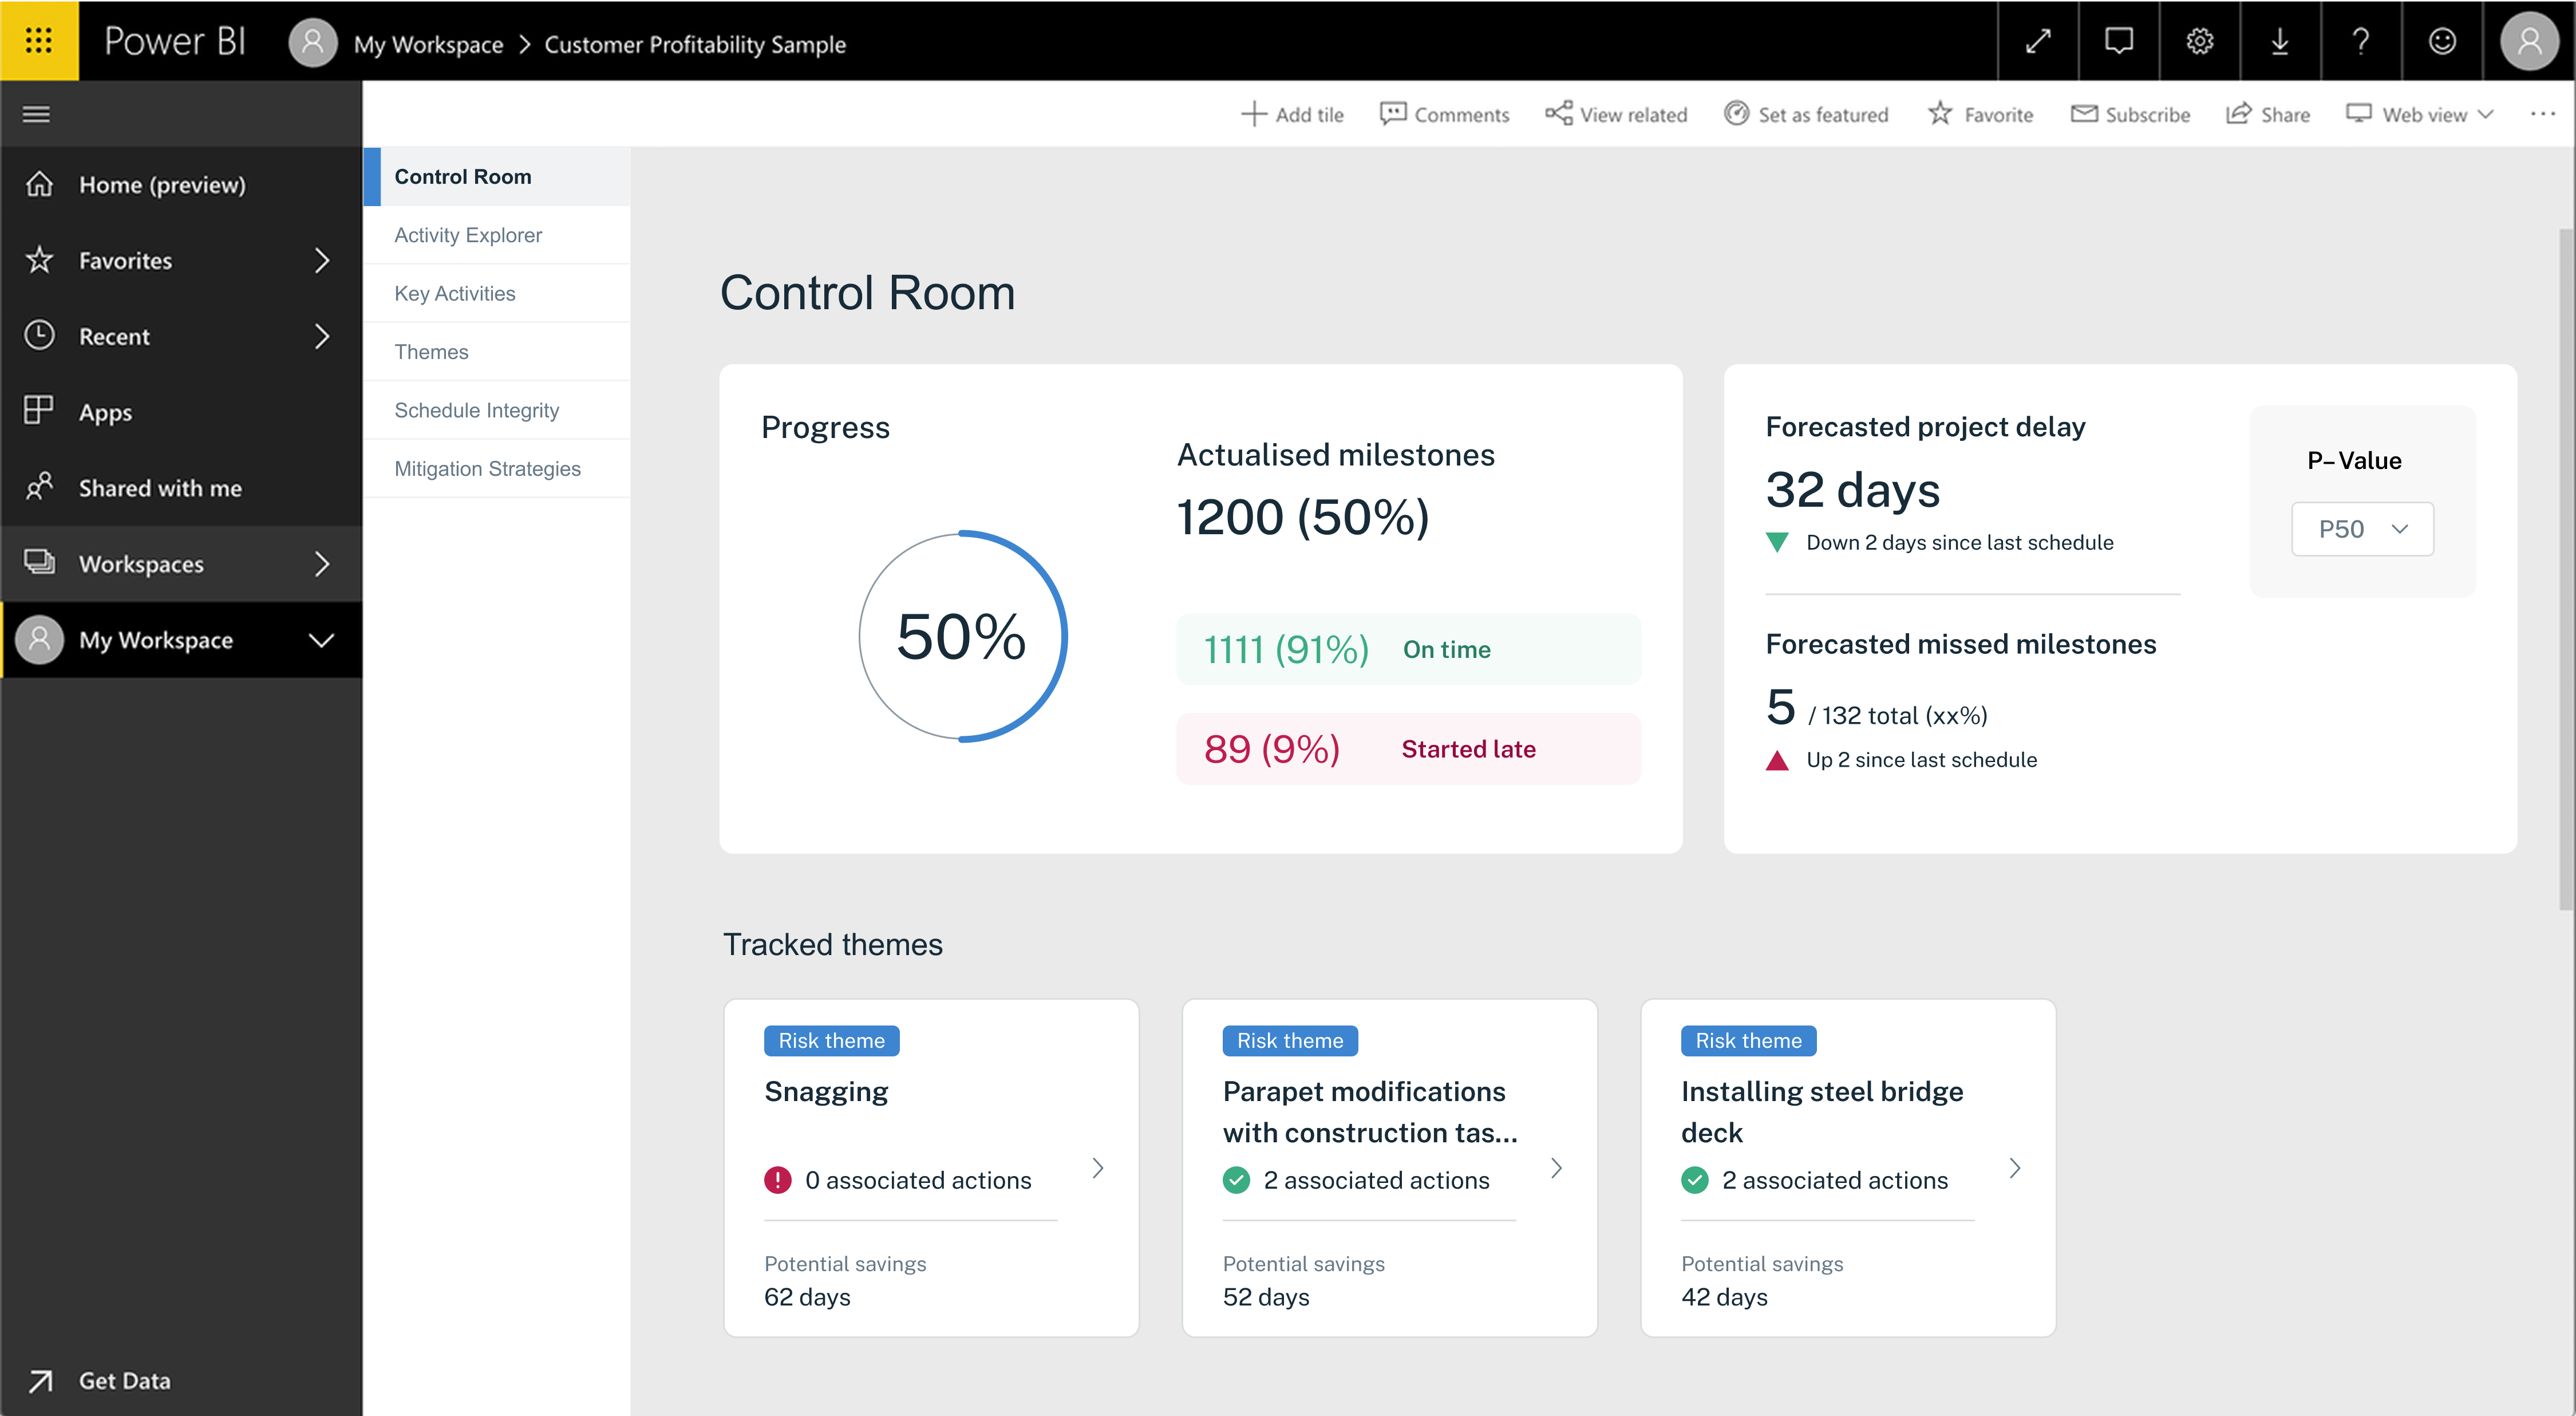
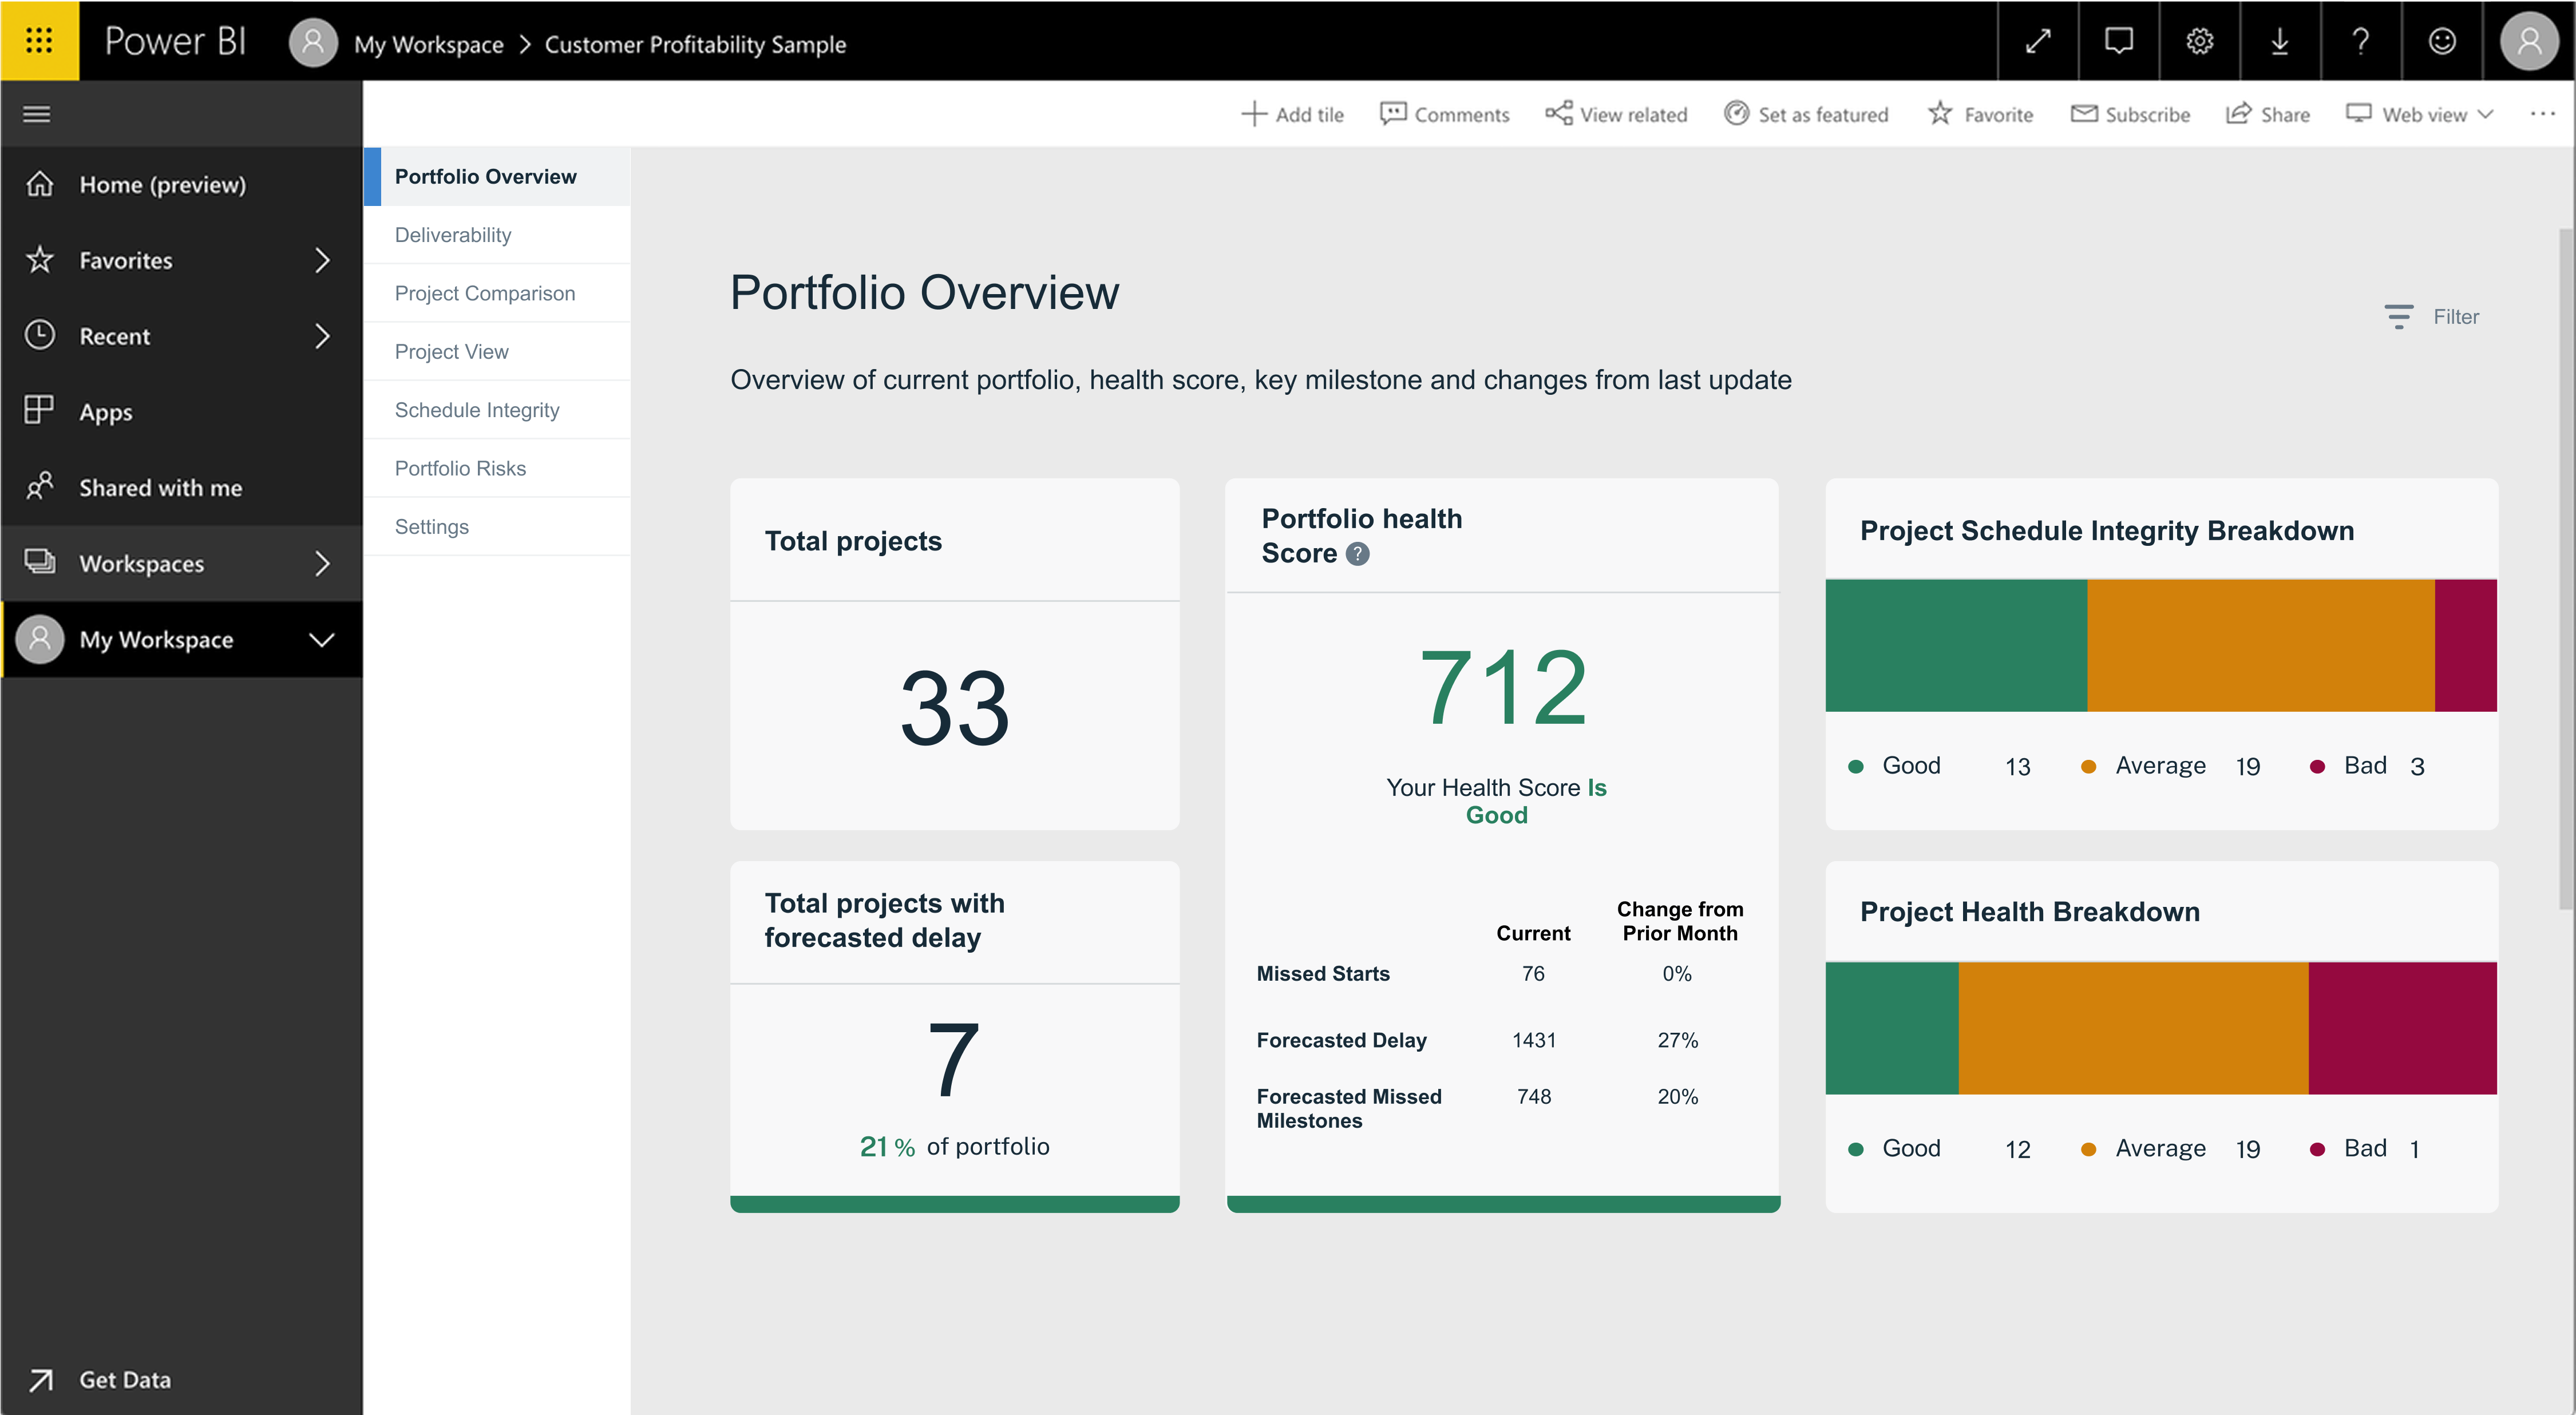
By streaming these outputs to Power BI, teams can track forecast vs. actual performance over time. The result is a living assurance dashboard that evolves with every schedule update and shows a real-time picture of project and portfolio health.
2. Transform your project controls organisation from reactive to proactive
nPlan’s forecasts act as leading indicators, highlighting potential slippage, bottlenecks, or systemic risks before they materialise. By integrating this data into Power BI, teams can go beyond retrospective reporting and move into proactive risk management - identifying where to intervene and when.
As Anglian Water’s PMO described it, they’ve gone from “Power BI dashboard hell” - looking only backward - to using nPlan for forward assurance, focusing on what’s likely to happen next and how to prevent delays before they occur.
3. Get everyone on the same page - and keep them there
With nPlan data visible inside Power BI, stakeholders across the delivery ecosystem gain a shared, data-driven view of risk and performance. Clients, contractors, and regulators can see the same forecasts and probabilities in one dashboard, making collaboration more transparent and evidence-based.
This aligns with one of nPlan’s key side-goals: to make contracting more collaborative by providing an unbiased, AI-driven view of schedule risk and delivery confidence that everyone uses - and can trust.
By piping nPlan Insights Pro and Portfolio data into Power BI, organisations can finally blend predictive AI with operational reporting to create a forward-looking view of performance where risks are identified and addressed long before they drive delay.
To learn more about enabling this integration, contact your nPlan account team or email info@nplan.io.
.png)