Reference Class Forecasting (RCF) vs nPlan
RCF benchmarks your project against similar completed ones; nPlan's AI-SRA forecasts every activity in your schedule. When to use each, in the UK and US.

TLDR: For owners, project controls leads and risk managers choosing a forecasting method: reference class forecasting (RCF) gives a top-down view of how similar completed projects performed and suits early budgets before a detailed schedule exists. nPlan's AI-SRA forecasts every activity in your own schedule, shows what is likely to drive delay and keeps working through delivery.
If you’re planning a major project, some of the first questions you’ll ask are: 'how long will this take?', and 'how much will it cost?'
For decades, the go-to method for answering these questions has been reference class forecasting (RCF). RCF is based on large datasets of completed projects and provides a top-down view: “Projects like this tend to take X months and overrun by Y%.”
But what if you could take a bottom-up view instead? What if you could understand the actual risk in every activity, given the whole context of your specific schedule, and understand the key drivers of delay before you break ground?
Reference class forecasting and nPlan's AI-driven Schedule Risk Analysis (SRA) take opposite routes to the same questions, and each makes sense at a different point in a project.
Our view is that the two methods answer different questions, so the real decision is when to move from one to the other. RCF is the right check on an early budget. Once a schedule exists, an activity-level forecast is where the decisions that prevent delay get made, and waiting for signs of slippage before starting one costs the time you most need.
INSIGHTS PRO · DRIVING PATHS
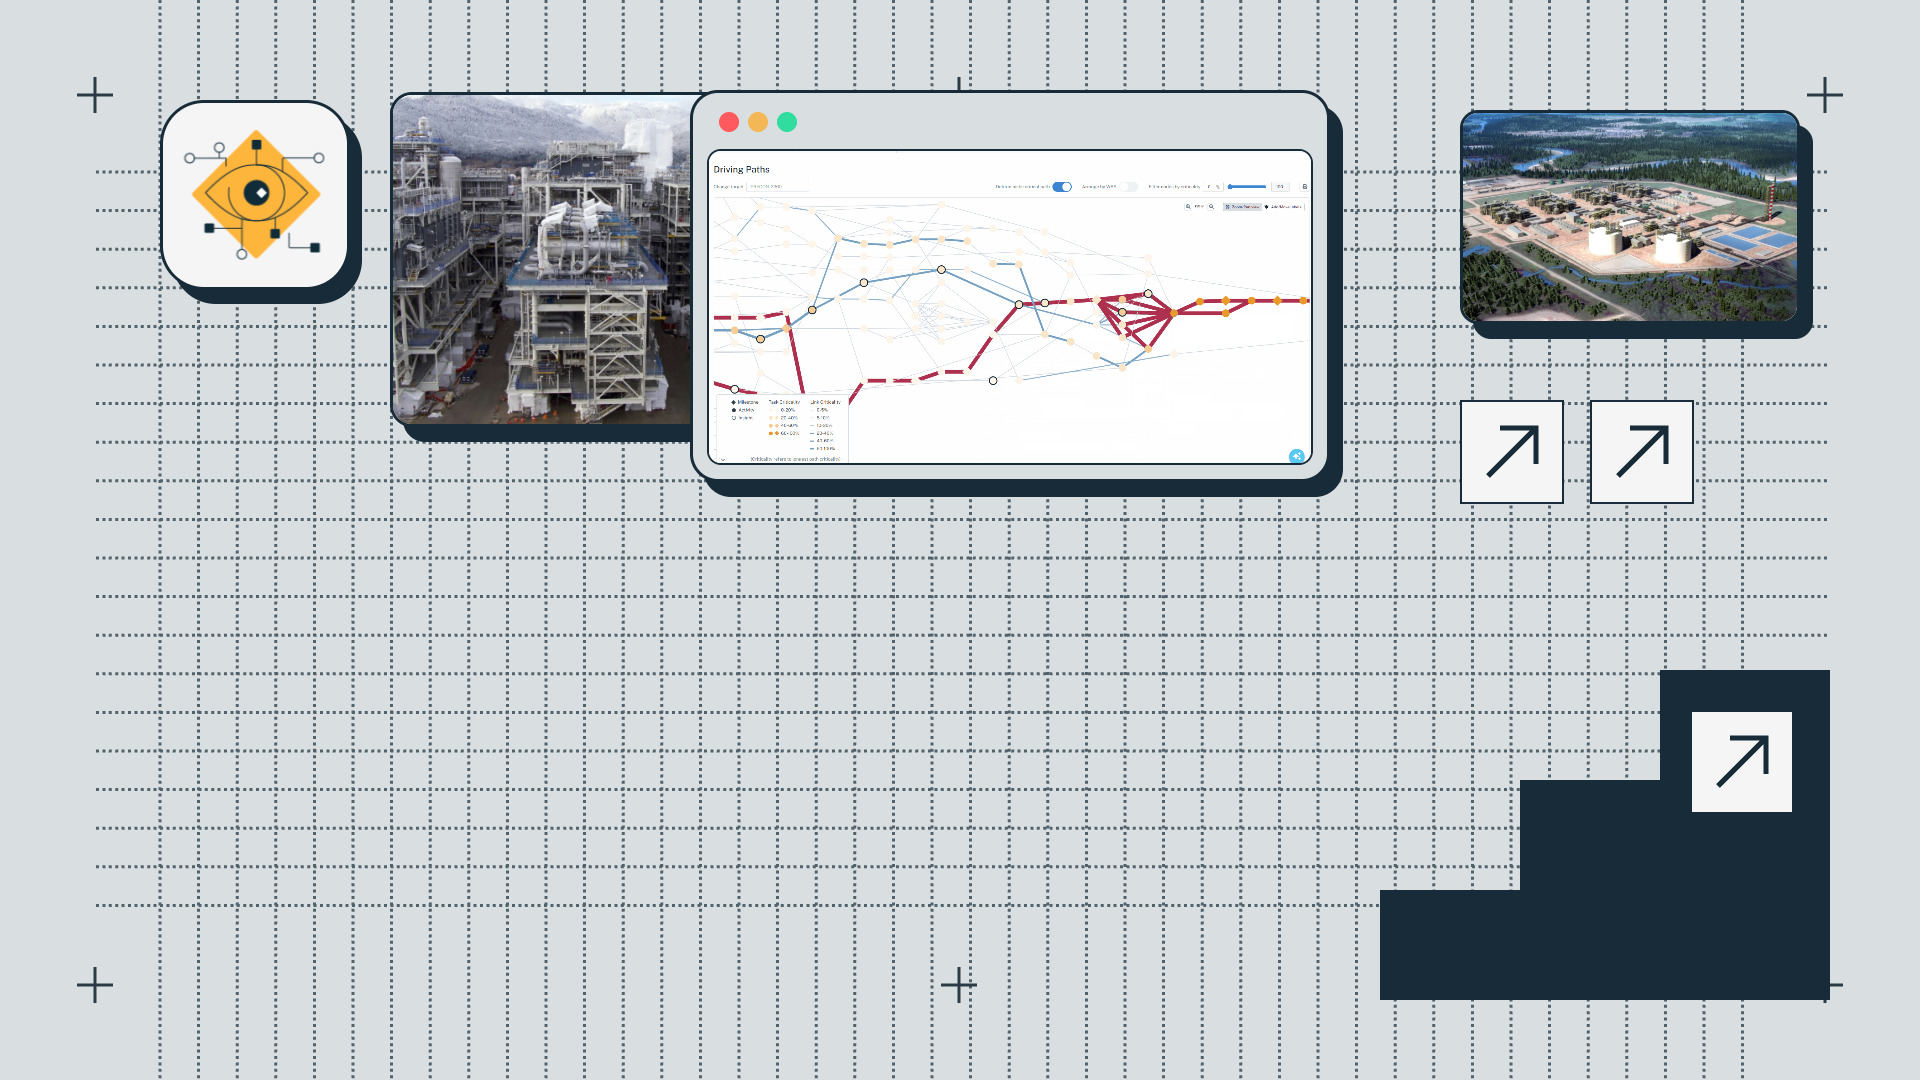
See the paths through your own schedule that are most likely to delay your key milestones, alongside the benchmark you already have.
See how Insights Pro worksWhat is the difference between reference class forecasting and nPlan?
Reference class forecasting predicts a project's cost or duration from the actual outcomes of a group of similar completed projects, then adjusts the team's own estimate to match. nPlan's AI-led schedule risk analysis (AI-SRA) forecasts each activity in the project's own schedule, using what our models have learned from more than 780,000 past project schedules, and rolls those forecasts up to key milestones and the completion date.
RCF therefore sets a realistic envelope for the whole project, while AI-SRA shows which activities and paths inside your plan are most likely to move the date.
What is RCF?
RCF was pioneered by Daniel Kahneman and Bent Flyvbjerg to counteract planning bias. It relies on comparing your project to a dataset of completed, similar projects (a reference class) and applying a statistical uplift to your cost and schedule forecasts.
The idea is simple: if 80% of projects like yours overrun by 25%, there’s a good chance yours will too. So rather than assume everything goes to plan, you forecast based on what actually happened in the past.
Big players:
- IPA (Independent Project Analysis) is the gold standard. Many operators treat an IPA benchmark as part of the standard stage-gate process, especially pre-FID. Their dataset spans tens of thousands of projects.
- Oxford Global Projects, led by Bent Flyvbjerg and Alex Budzier, provides RCF data and guidance across infrastructure, IT, mining, and more.
Typical use case: RCF is most commonly used early in the project lifecycle, to create a realistic baseline. It’s particularly helpful when you have limited information about the project’s execution path but still need to plan and justify budgets.
The value: RCF is meant to give decision-makers a reality check. It’s a great way to sanity check optimism bias and answer the question: “Are we being too ambitious?” (John Hollmann is the authority on this).
The method's roots are academic. Flyvbjerg's 2006 paper in the Project Management Journal grounds it in the decision research that won the 2002 Nobel prize in economics and describes its first practical use, for cost forecasts on large transport infrastructure projects.
How is reference class forecasting used in the UK and the US?
Both markets use the outside view, but it reaches projects through different routes and rules.
How is RCF used on UK public projects?
In the UK, reference class forecasting is built into public-sector appraisal through optimism bias uplifts. HM Treasury's Green Book supplementary guidance on optimism bias says explicit adjustments should be made to estimates of a project's costs, benefits and duration, and it supplies cost and time uplift percentages for generic project categories.
Transport goes further. The Department for Transport's TAG Unit A1.2 on scheme costs (May 2025) describes its optimism bias adjustment as an outside view and a top-down approach based on RCF techniques. Its recommended cost uplift for rail schemes, drawn from Oxford Global Projects (2020) data, is 56% at PACE Stage 1, 33% at PACE Stage 3 and 30% at PACE Stage 5 (for other schemes, these map to the Strategic Outline, Outline and Full Business Case), and the guidance requires these uplifts for the economic case.
Illustrative scenario (assumptions labeled, not a real project). A rail line upgrade has a base capital cost estimate of £400 million at PACE Stage 1. Applying the TAG rate gives an uplift of £224 million (400 × 0.56), so the economic case carries £624 million. If the same base estimate held at PACE Stage 5, the uplift would fall to £120 million (400 × 0.30), giving £520 million.
What the uplift cannot tell the sponsor is which possession, consent or commissioning activity will absorb that extra time and money. TAG itself expects reliance on optimism bias uplifts to reduce as project-specific risks are better understood and quantified. In our view, much of that understanding comes from analyzing the schedule.
How is RCF used on US capital projects?
In the US, the outside view usually reaches capital projects through benchmarking and parametric contingency methods. Owners in energy and process industries commonly benchmark against IPA before authorization; IPA states that its proprietary databases cover more than 20,000 projects, and its Industry Benchmarking Consortium 2025 findings report that average schedule slip has roughly doubled over the past two decades and now hovers around 18 percent.
AACE International's recommended practice 42R-08 sets out parametric methods, generally empirically based, for estimating cost and schedule contingency. For the schedule itself, the US Government Accountability Office lists a schedule risk analysis as best practice 8 in its Schedule Assessment Guide (GAO-16-89G): it starts from a good critical path method schedule and predicts the level of confidence in meeting the completion date. AACE's 117R-21 covers combining parametric and CPM-based methods, provided steps are taken to avoid double-counting sources of risk. Our article on risk reviews in US transit programs looks at how this plays out for transportation agencies.
What is nPlan AI-SRA?
nPlan takes a very different approach. Rather than starting from high-level comparisons, it dives deep into the schedule itself.
Here’s how it works:
- You upload a schedule file (e.g. Primavera P6) with all activities, durations, logic, and constraints.
- nPlan uses AI trained on more than 780,000 past project schedules to forecast how each activity is likely to unfold.
- It considers over 160 contextual features for each task: lag types, float, resource density, calendar logic, and more.
- The result is a probabilistic forecast of the full schedule, from the ground up.
This isn’t just a one-time forecast. nPlan can be re-run every time the schedule is updated, from pre-FID to commissioning and close out. That means teams can continuously re-analyze and action risk as work progresses.
Because nPlan forecasts at activity level rather than comparing whole projects, it doesn't need a near-identical past project in its dataset. It learns how different types of work actually perform and applies that to each activity in the context of your schedule, which is why it can forecast first-of-a-kind projects that have no obvious reference class. Schedules can come from Primavera P6, Asta Powerproject or Microsoft Project.
Typical use case: While nPlan can absolutely be used early in the lifecycle (e.g. to stress test a proposed baseline or compare options), its real strength shows up in delivery. That’s when reality deviates from the baseline and new risk emerges daily.
The value: nPlan delivers fast, detailed, data-driven schedule assurance based on actual activity logic. It helps teams respond to change before delays compound. And it does this by empowering real project teams with real data driven insights.
In Insights Pro, those forecasts feed Driving Paths, which shows the paths most likely to affect a milestone, and Mitigation Strategies, which tests how much a proposed change would move the forecast. Our white paper From QSRA to AI-SRA sets out how this approach sits alongside traditional quantitative schedule risk analysis.
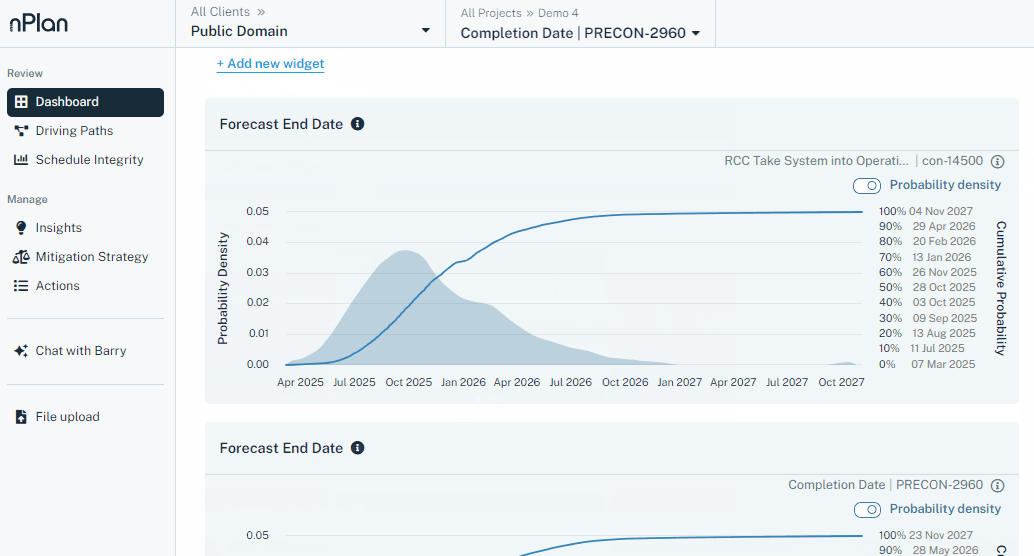
Top-down vs bottom-up: key differences
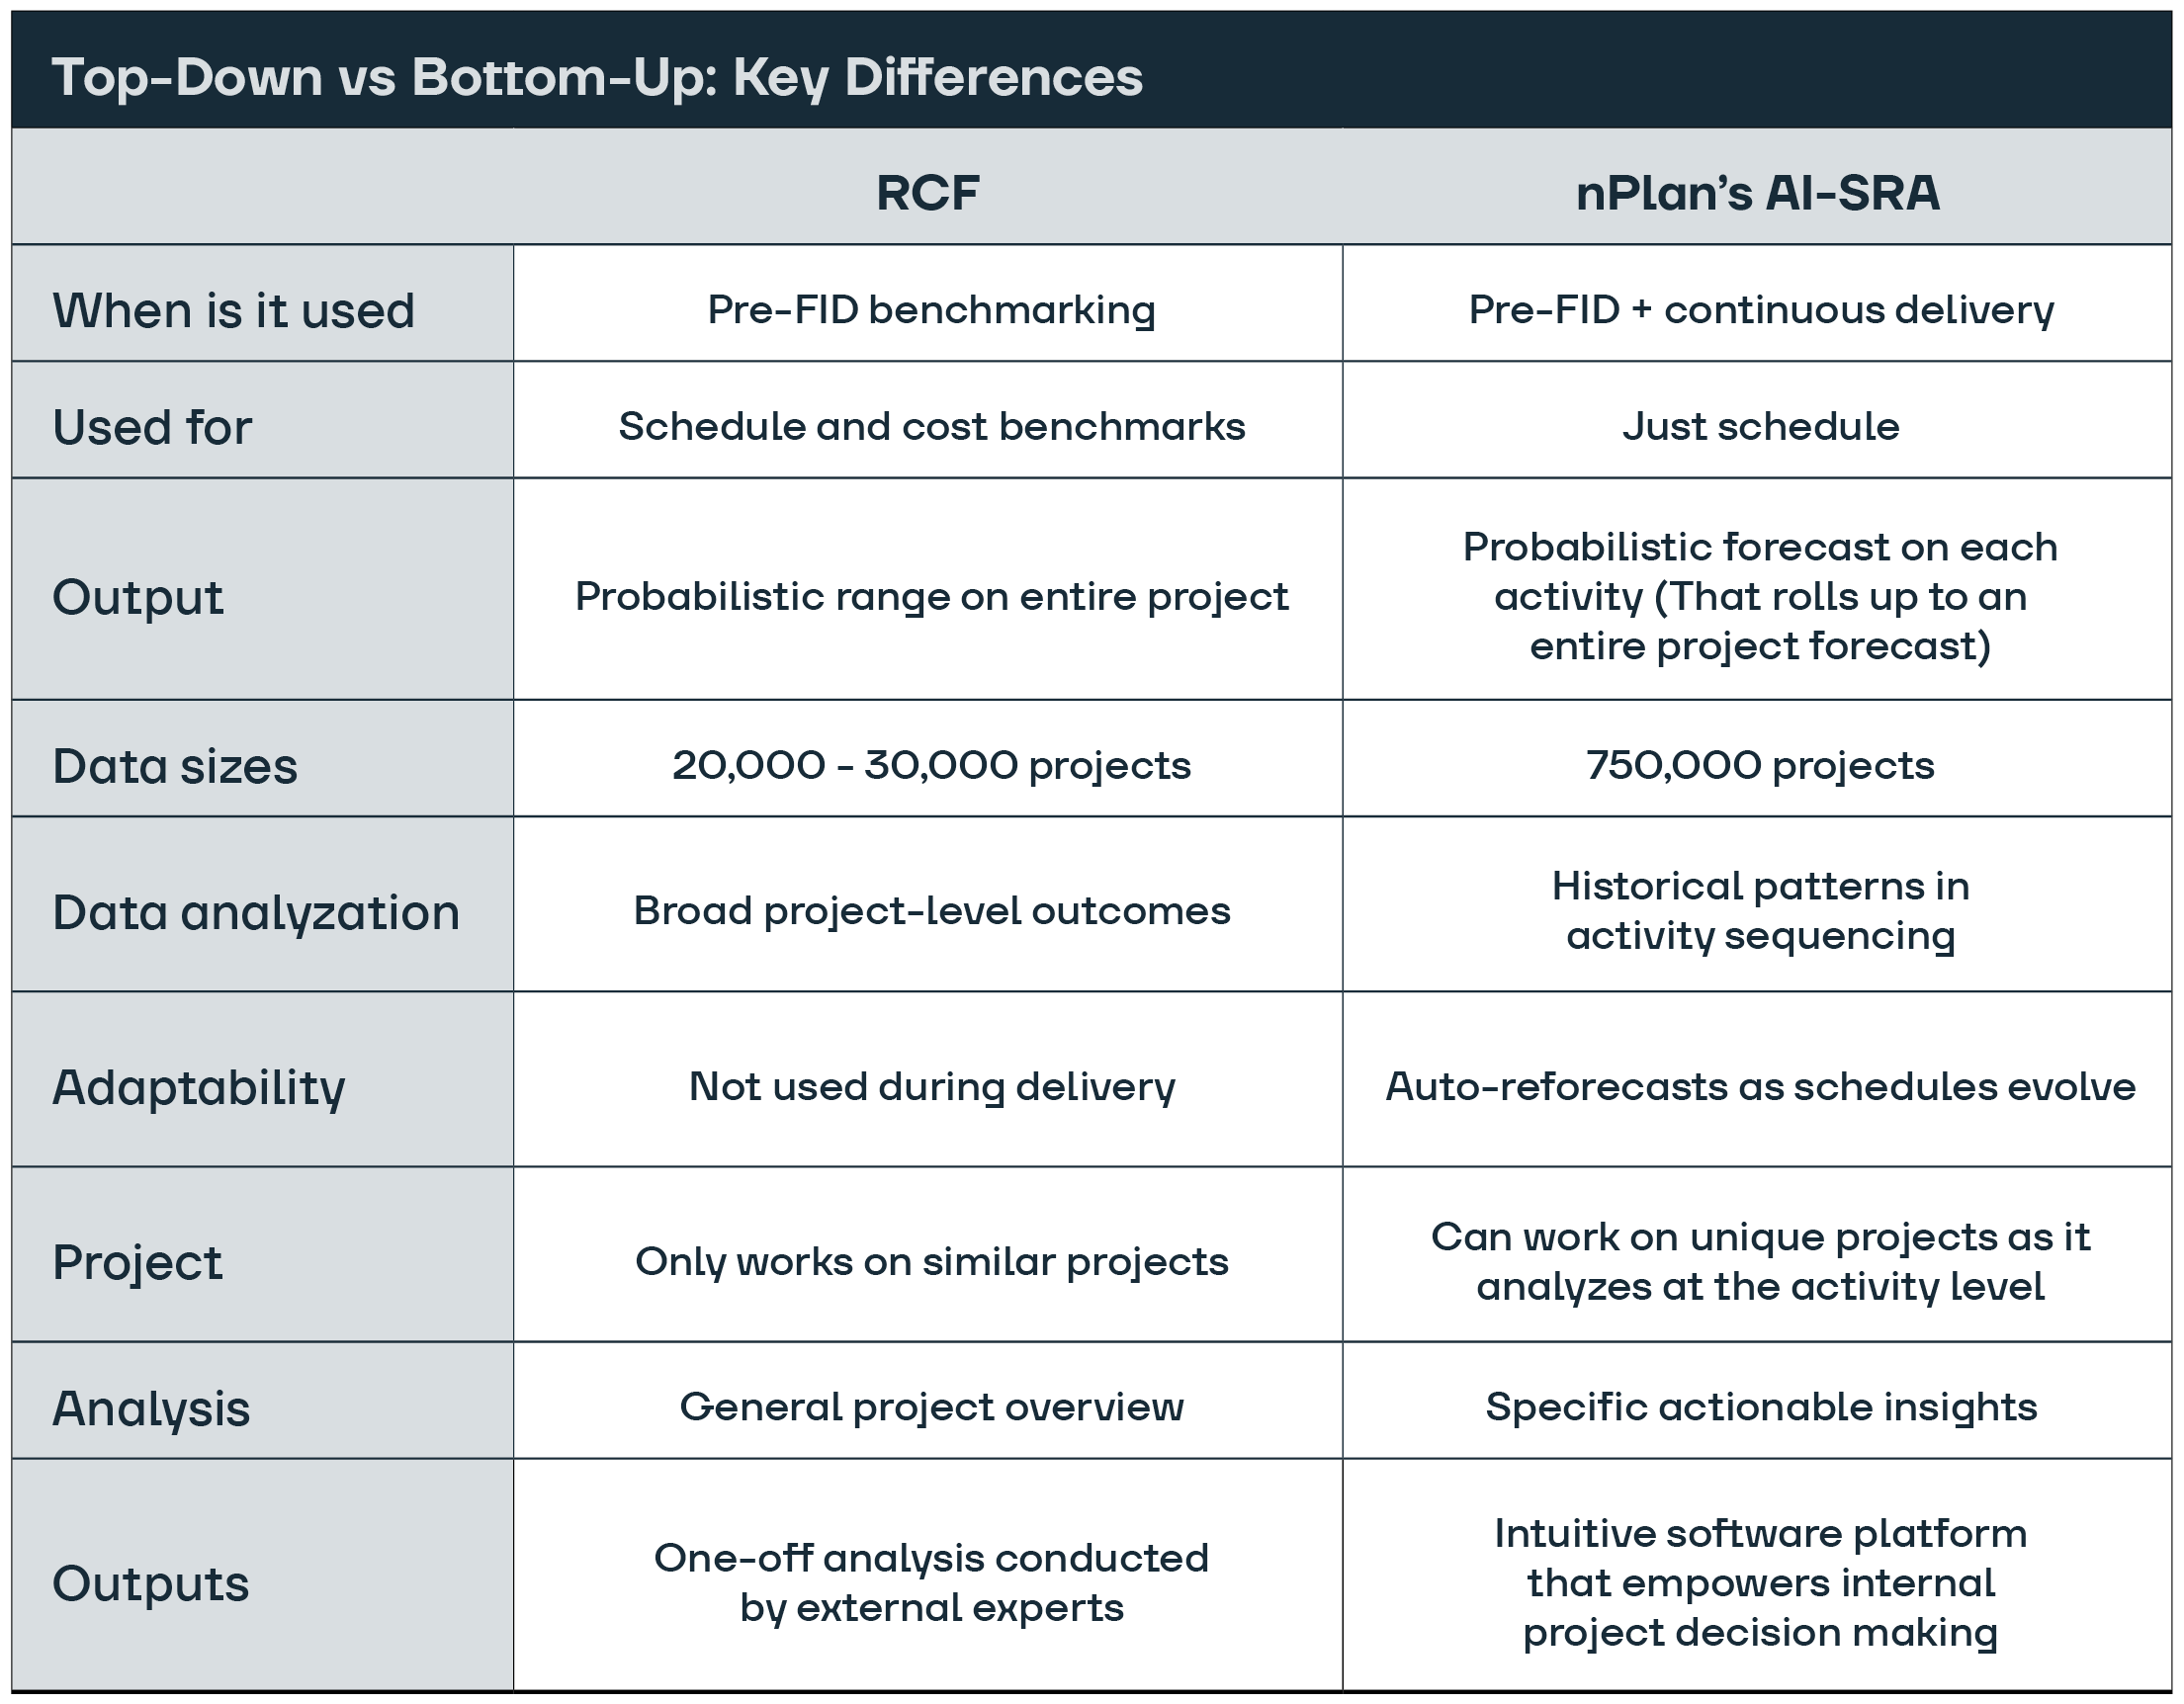
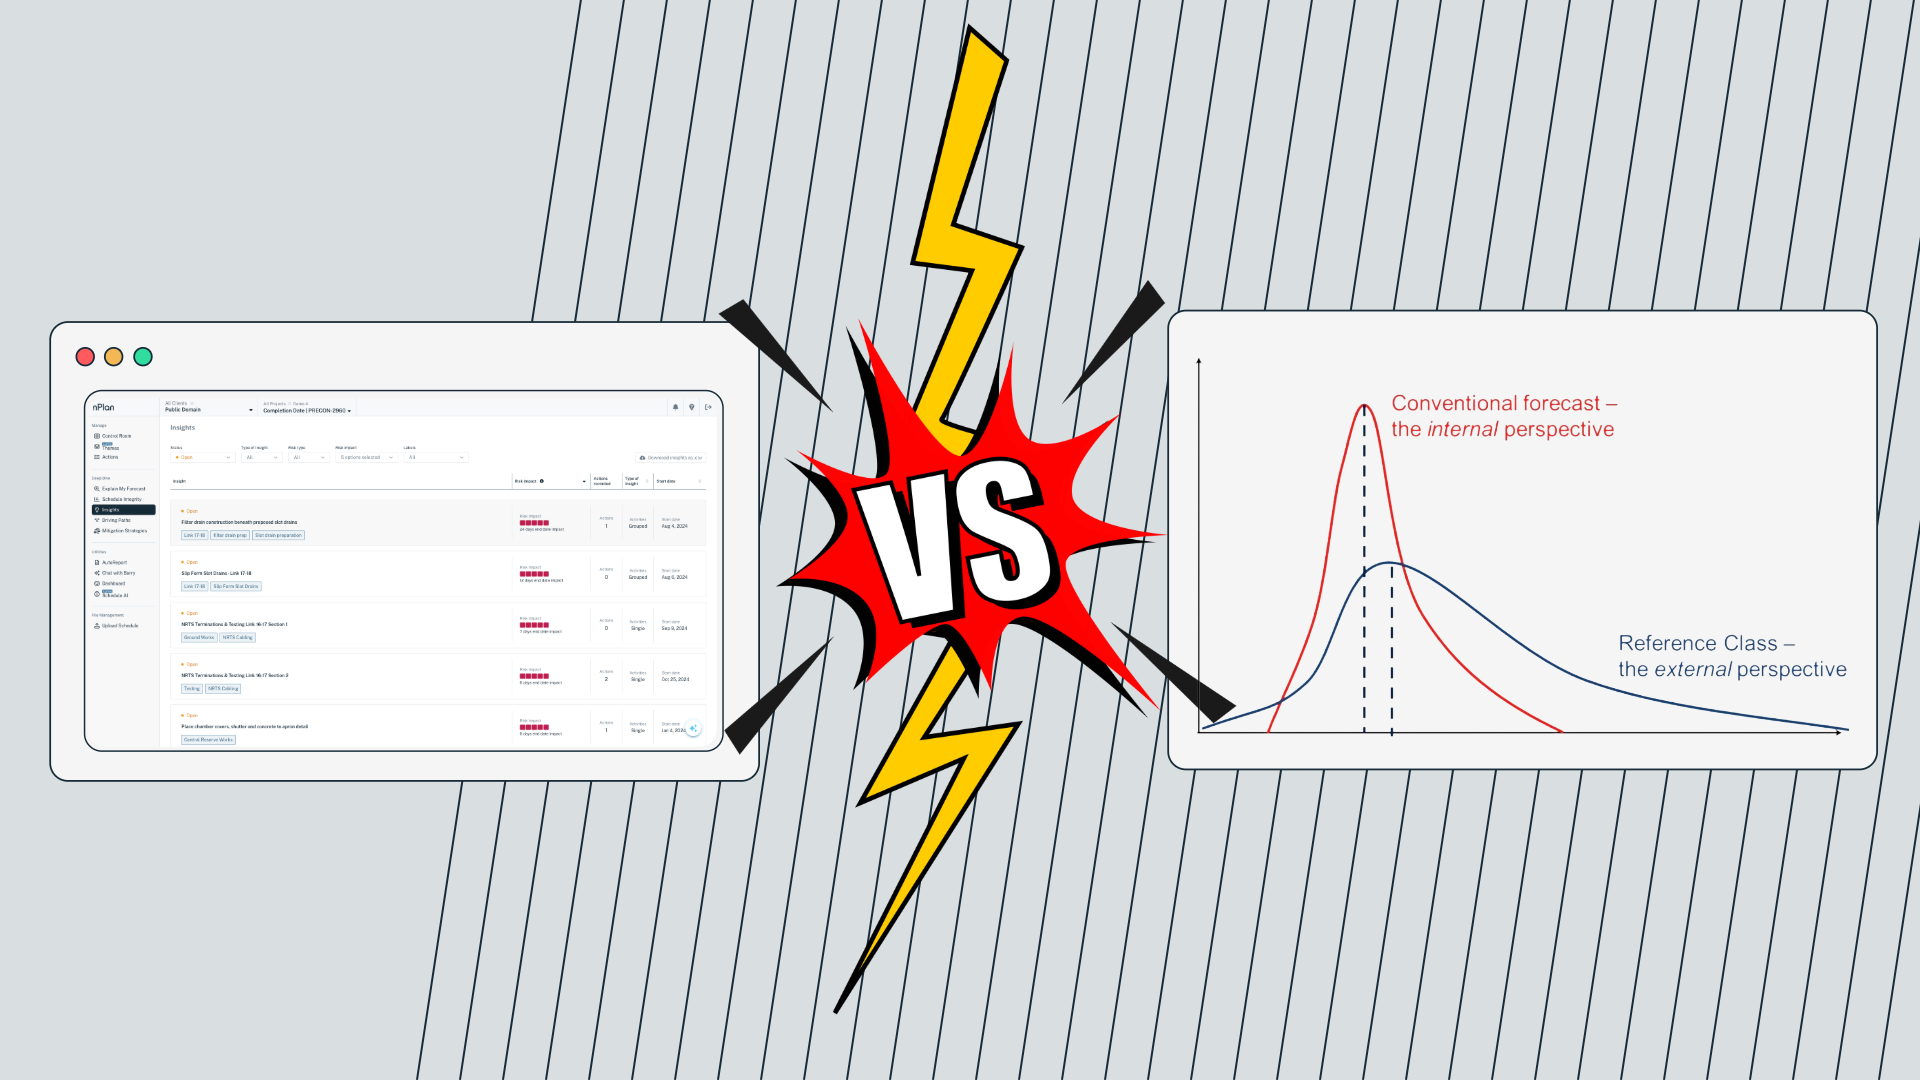
RCF answers: “How did other projects like this perform?”
nPlan answers: “Given the actual logic and context of this schedule, how is this project likely to unfold?”
Set side by side, the differences come down to where each method starts, what it needs and how often it runs.
| Question | Reference class forecasting | nPlan AI-SRA |
|---|---|---|
| Starting point | Outcomes of similar completed projects | Your schedule's activities, logic and constraints |
| Unit of analysis | The whole project | Every activity, rolled up to milestones |
| Best timing | Concept and early business case | Pre-FID through delivery and close out |
| Data behind it | A reference class of comparable projects | More than 780,000 past project schedules |
| Output | An uplift or range for cost and duration | A probabilistic forecast plus the activities driving delay |
| Similar project needed? | Yes, a relevant reference class | No, it learns how types of work perform |
| How often | Usually once per stage gate | Every schedule update |
When should you use each?
Use RCF when:
- You’re early in the planning process and need a reality check.
- You don’t have a detailed schedule yet.
Use nPlan when:
- You have a L2 schedule at pre-FID and need more accurate assurance.
- You want to pinpoint and understand what will likely cause the delay on your project.
- Your contractor constantly changes the schedule and you need to challenge them quickly.
You don’t have to wait to use nPlan. Too often, teams delay deep schedule assurance until things go wrong. They treat RCF as a checkbox, then hope for the best. Then they get in touch 20% into delivery and there are signs of slippage already.
Can you use RCF and nPlan together?
Yes, and on major projects the two work best in sequence. RCF tests whether the overall budget and duration are plausible; an activity-level forecast then shows where in the schedule that risk sits and what to do about it. AACE's 117R-21 is a useful guide when combining a top-down and a schedule-based view, because counting the same risk twice inflates contingency.
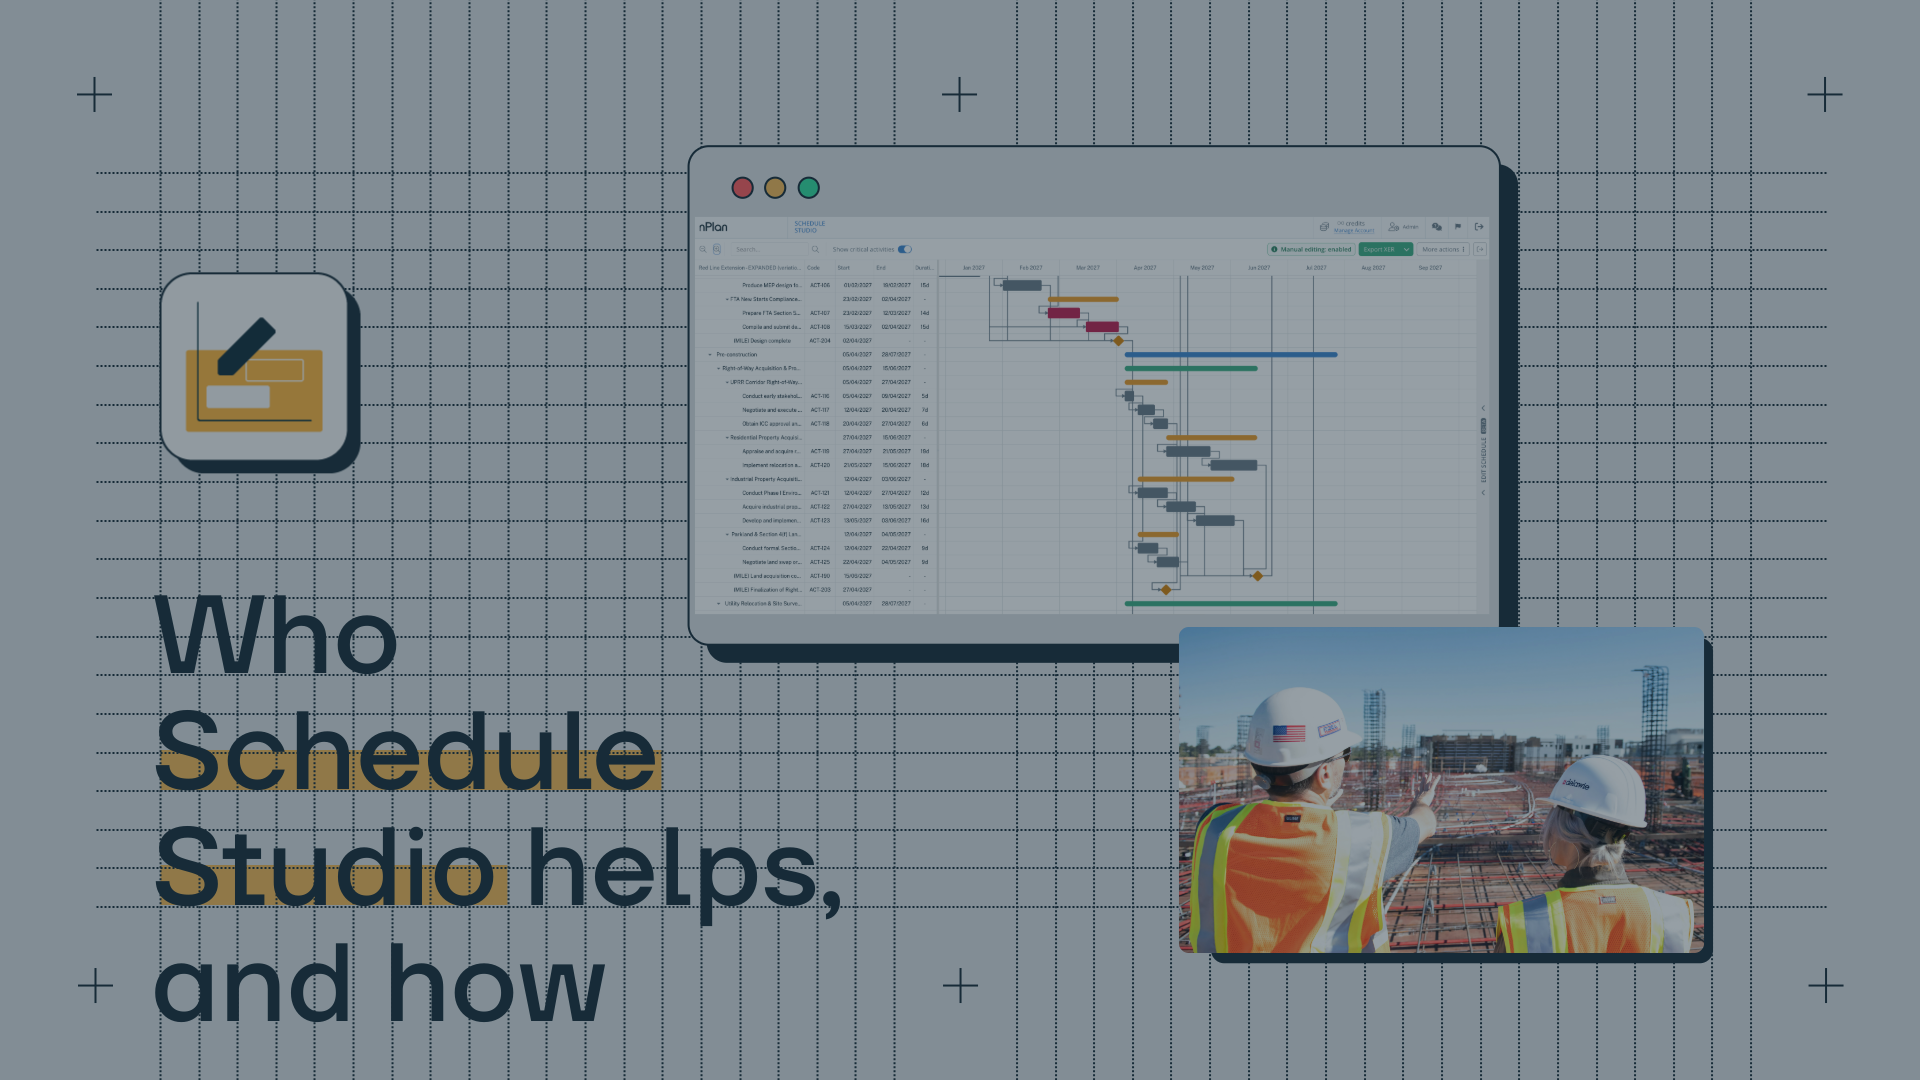
The gap between the two stages is often simply the absence of a detailed schedule. Schedule Studio turns scope documents into a logic-linked first schedule with WBS, durations and critical path that your planners review and refine, so a bottom-up forecast can start earlier than it otherwise would.
What does this look like on a live project?
On LNG Canada, the export facility at Kitimat, British Columbia, with an initial capacity of 14 million tonnes per annum, the project team used nPlan during construction. In our case study on LNG Canada, the team describes nPlan as "part of our toolkit to help us anticipate risk and capture opportunity on the Project", adding that data from other project schedules helps it focus conversations on the areas that could have the biggest impact. That is the delivery-phase job a one-off benchmark is not designed to do.
Why start sooner?
We get it, benchmarks are comfortable. They’re broad, they’re familiar, and they look official in a slide deck.
But they don’t tell you much about your schedule.
The earlier you use nPlan, the more confidence you gain in the logic, risk, and realism of your plan. You can:
- Catch weak sequences or overly optimistic durations.
- See which activities are driving delivery risk.
- Stress test alternative schedules before committing.
Additionally, nPlan is an embedded capability within your team that stays with you throughout the lifecycle of the project. A recent IPA report found that resource constrained teams experienced poorer project outcomes when they experienced staff churn. With nPlan the resource constraints are lessened and the continuity of knowledge and capability within the team maintained.
Wrap-up
RCF and benchmarking have an important role to play in early project assurance. They set the stage. They challenge optimism. And they’re part of the DNA of project controls in many sectors.
It’s time we stop treating forecasting as a one-and-done exercise. The best project teams are moving toward continuous assurance, and the ones who start early are the ones who stay ahead.
SCHEDULE STUDIO · SCOPE ASSUMPTIONS AND WBS REVIEW
No detailed schedule yet? Turn your scope documents into a first draft with a WBS and stated scope assumptions your planners can review and refine, ready to forecast.
Try Schedule StudioFrequently asked questions
Who invented reference class forecasting?
Reference class forecasting comes from Daniel Kahneman and Amos Tversky's research on planning bias and the outside view, work that contributed to Kahneman's 2002 Nobel prize in economics. Bent Flyvbjerg turned it into a practical forecasting method for projects, first applied to cost forecasts for large transport infrastructure projects.
Is reference class forecasting required in the UK?
For many public projects, an equivalent adjustment is expected. HM Treasury's Green Book guidance asks for explicit optimism bias adjustments to costs, benefits and duration, and the Department for Transport's TAG Unit A1.2 requires optimism bias uplifts, based on reference class forecasting, in the economic case for transport schemes.
How do US owners get an outside view of their project?
Most use benchmarking against completed projects, such as IPA's databases before authorization, or parametric contingency methods like those in AACE International's 42R-08. They then test the schedule itself with a schedule risk analysis, which GAO's Schedule Assessment Guide lists as a best practice.
Does nPlan need a similar past project to forecast mine?
No. nPlan forecasts each activity using what our models have learned from more than 780,000 past project schedules about how different types of work perform, so it does not depend on finding a near-identical completed project.
Can nPlan replace a reference class forecast?
Not at the earliest stage. Before a detailed schedule exists, RCF or a benchmark is the right reality check. Once there is a schedule, nPlan adds an activity-level view that the benchmark cannot provide, and your team still validates the findings and makes the decisions.
Sources
- HM Treasury, Green Book supplementary guidance: optimism bias (April 2013)
- Department for Transport, TAG Unit A1.2 Scheme Costs (May 2025)
- Bent Flyvbjerg, From Nobel Prize to Project Management: Getting Risks Right, Project Management Journal 37(3), 2006
- Independent Project Analysis, What is the key to delivering more predictable projects?
- AACE International Recommended Practice 42R-08: Risk Analysis and Contingency Determination Using Parametric Estimating
- AACE International Recommended Practice 117R-21: combining parametric and CPM-based methods
- GAO Schedule Assessment Guide: Best Practices for Project Schedules (GAO-16-89G), December 2015
- John Hollmann on schedule contingency (LinkedIn)
- nPlan, LNG Canada case study
- nPlan, From QSRA to AI-SRA (white paper)
- nPlan Insights Pro
- nPlan Schedule Studio