How can a PMO spot schedule risks shared by several projects or contractors?
A PMO finds a shared schedule risk in the forecast drivers behind each date: label them the same way on every scheme and act once when a driver recurs.
Written by
Stacey Gray
Believes the world's biggest projects deserve better than guesswork. Powered by customer stories, products that solve real problems, and the occasional gelato.
Updated 10 November 2026
Key takeaways: For owner PMOs, portfolio managers and programme directors, a shared schedule risk shows up in the forecast drivers behind each date. Label every schedule's drivers by contractor, type of work, interface and milestone at each update, and treat a driver as shared when it recurs, moves together across updates and answers to one decision.
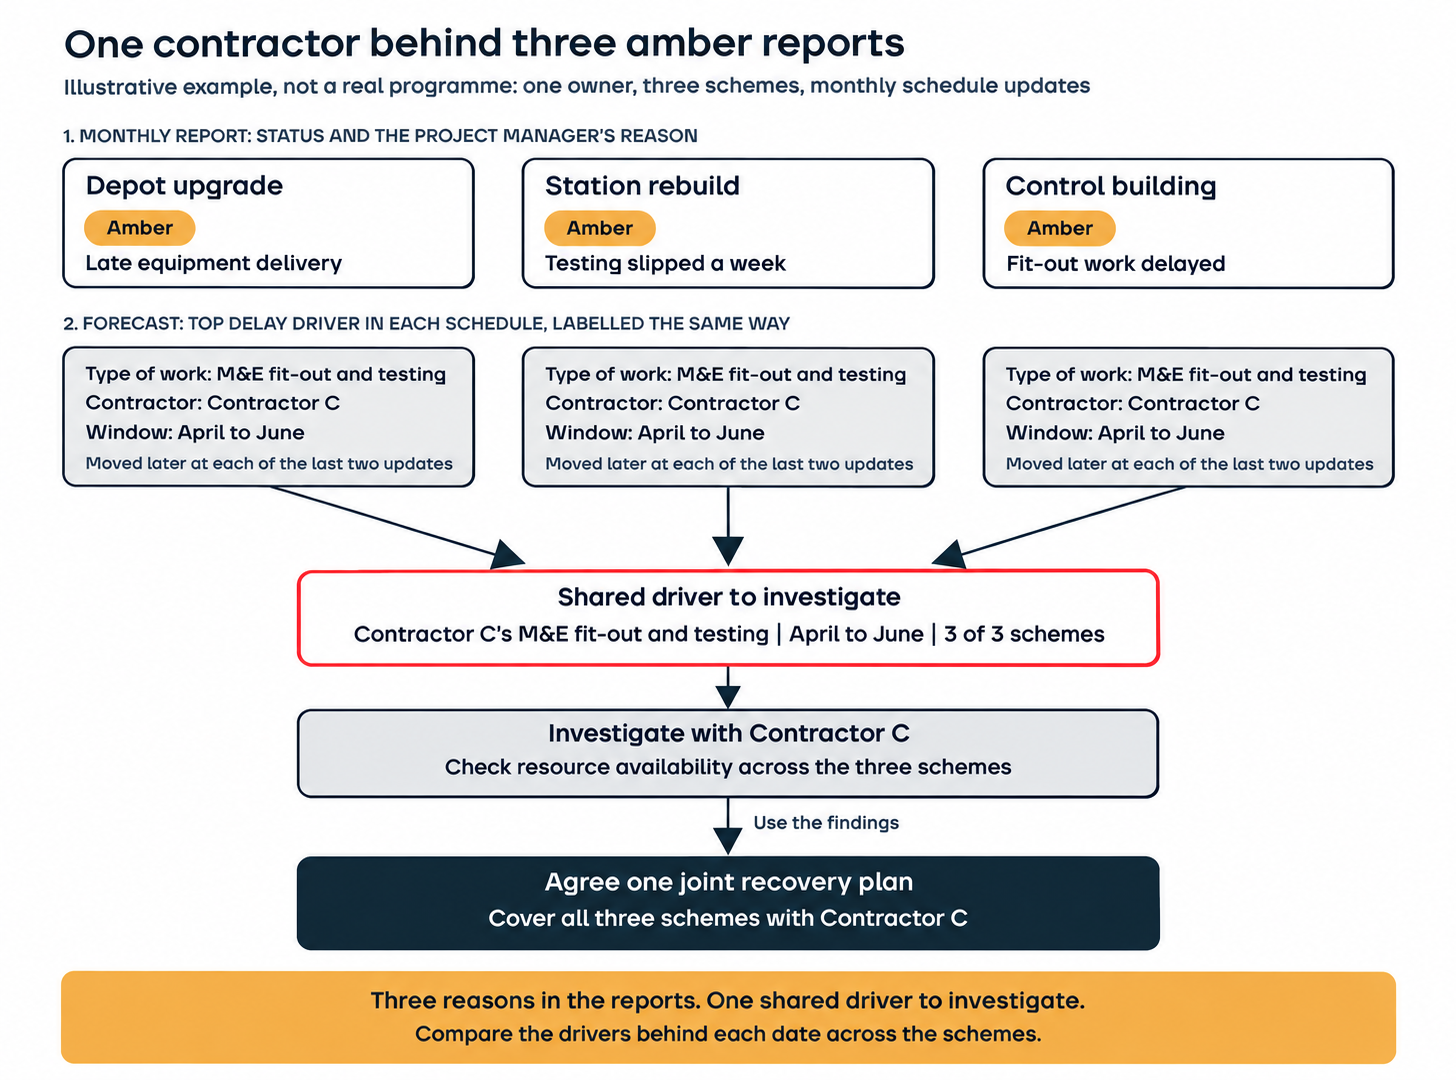
Take an illustrative portfolio review. The depot upgrade, the station rebuild and the control building are all amber, and each project manager gives a different, reasonable cause: late equipment, a lost testing week, a delay to fit-out work. Line up the forecast drivers behind those three dates and the same mechanical and electrical (M&E) contractor's fit-out and testing work sits close to the critical path on all three, in the same quarter.
The colours could only ever show three local problems; the shared contractor appears once every driver is labelled the same way at every update and compared across schedules. A portfolio dashboard that only rolls up red, amber and green ratings cannot show that driver, so the case for portfolio-level software rests on consistent forecasts and drivers across many schedules.
Portfolio · Systemic risks
See what is driving risk and delay across your schemes, from regions to contractors to key milestones, with the projects each issue touches.
What are the steps for finding a shared schedule risk?
A PMO spots a shared schedule risk by forecasting every live schedule the same way, tagging the drivers behind each forecast with one common set of labels and looking for the labels that repeat across schemes. The steps fit inside the monthly schedule update cycle:
Forecast every live schedule the same way: Use one method on every scheme at each update, so a driver on one scheme can be compared with a driver on the next.
Label each driver with one shared set of tags: Record the contractor, the type of work, the interface and the milestone each top driver threatens, in the same words on every scheme.
Count recurrence across schemes: List the labels that appear on more than one scheme, with the schemes and the forecast window each one touches.
Test each candidate: Keep a driver as shared when it recurs, moves the same way between updates and could be changed by one decision.
Give the shared driver one owner and one decision: Take it to the person who holds the lever, and check its effect at the next update.
Before comparing drivers, check the schedules behind them. GAO's Schedule Assessment Guide (GAO-16-89G) sets out ten best practices for developing and maintaining a reliable, high-quality schedule. Those checks help assess the input; meeting them does not by itself establish that a forecast is trustworthy.
The labels carry the method. A project manager writes "late equipment" and another writes "crew shortage", and both may be describing the same subcontractor. Once the drivers sit under the same tags, the overlap is visible in a sorted list.
Why can a status report miss a risk that several schemes share?
A status report can miss a shared risk because each project rates its own exposure, in its own words, against its own milestones. A colour summarises a local judgement, so three ambers with three different explanations read as three separate problems, each with a reasonable recovery plan.
The UK government's own portfolio body is explicit about the limits of a rating. In its Major Projects Annual Report 2025-26, the National Infrastructure and Service Transformation Authority (NISTA) rated 109 of the 189 projects in the Government Major Projects Portfolio amber at 31 March 2026, and it describes its delivery confidence assessments as "not a comprehensive reflection of project performance". The same report sets NISTA's aim as using its data to "identify risks, spot patterns and act before problems become harder to address". Spotting a pattern needs the cause behind each rating, recorded in a form that can be compared.
How do you tell a shared driver from a coincidence?
A driver is shared when it passes three tests together: it recurs across schemes, it moves the same way between updates, and one decision could change it on every scheme it touches. Two schemes that both slip on testing in different years, with different contractors, share a word and little else. Two schemes whose forecasts both depend on one contractor's commissioning work in the same quarter share a driver to investigate.
Illustrative example: three amber reports with different explanations flag the same forecast driver. The PMO can investigate it with Contractor C and use what they find to agree one recovery plan across the three schemes.
The third test is the one that earns the PMO's time. If the shared driver is one contractor's work, the lever is a planning conversation with that contractor across every affected scheme. If it is a type of work done by different contractors, the lever may be how the owner sequences and procures that work across the portfolio. If no single decision reaches it, it belongs back with each project team.
Where can a shared schedule risk sit?
Shared schedule risk can sit wherever several schemes draw on the same scarce thing in the same window:
A contractor or subcontractor whose work drives several schemes in overlapping windows. Check resource commitments with that contractor before concluding that the same team is stretched across them.
A labour or plant market that tightens for every scheme in a region at once.
A common interface, such as a shared connection, a shared access window or the same third party reviewing designs for several schemes. Where several schemes rely on the same approval body, the PMO checks that body has the capacity to handle them all.
A repeated type of work, where the same activity type drives the forecast on scheme after scheme even with different contractors.
Two projects in the same portfolio can face staffing shortages without sharing a cause. In its February 2026 update on National Science Foundation projects, GAO-26-107842, the US Government Accountability Office reported that four of seven major projects in construction had delays of 4 to 27 months relative to the schedules GAO reported in June 2024, as of July 2025. The report describes staffing shortages on the Antarctic infrastructure project and labour shortages at the research-vessel shipyard, alongside other causes of delay. The report identifies no shared workforce or common cause.
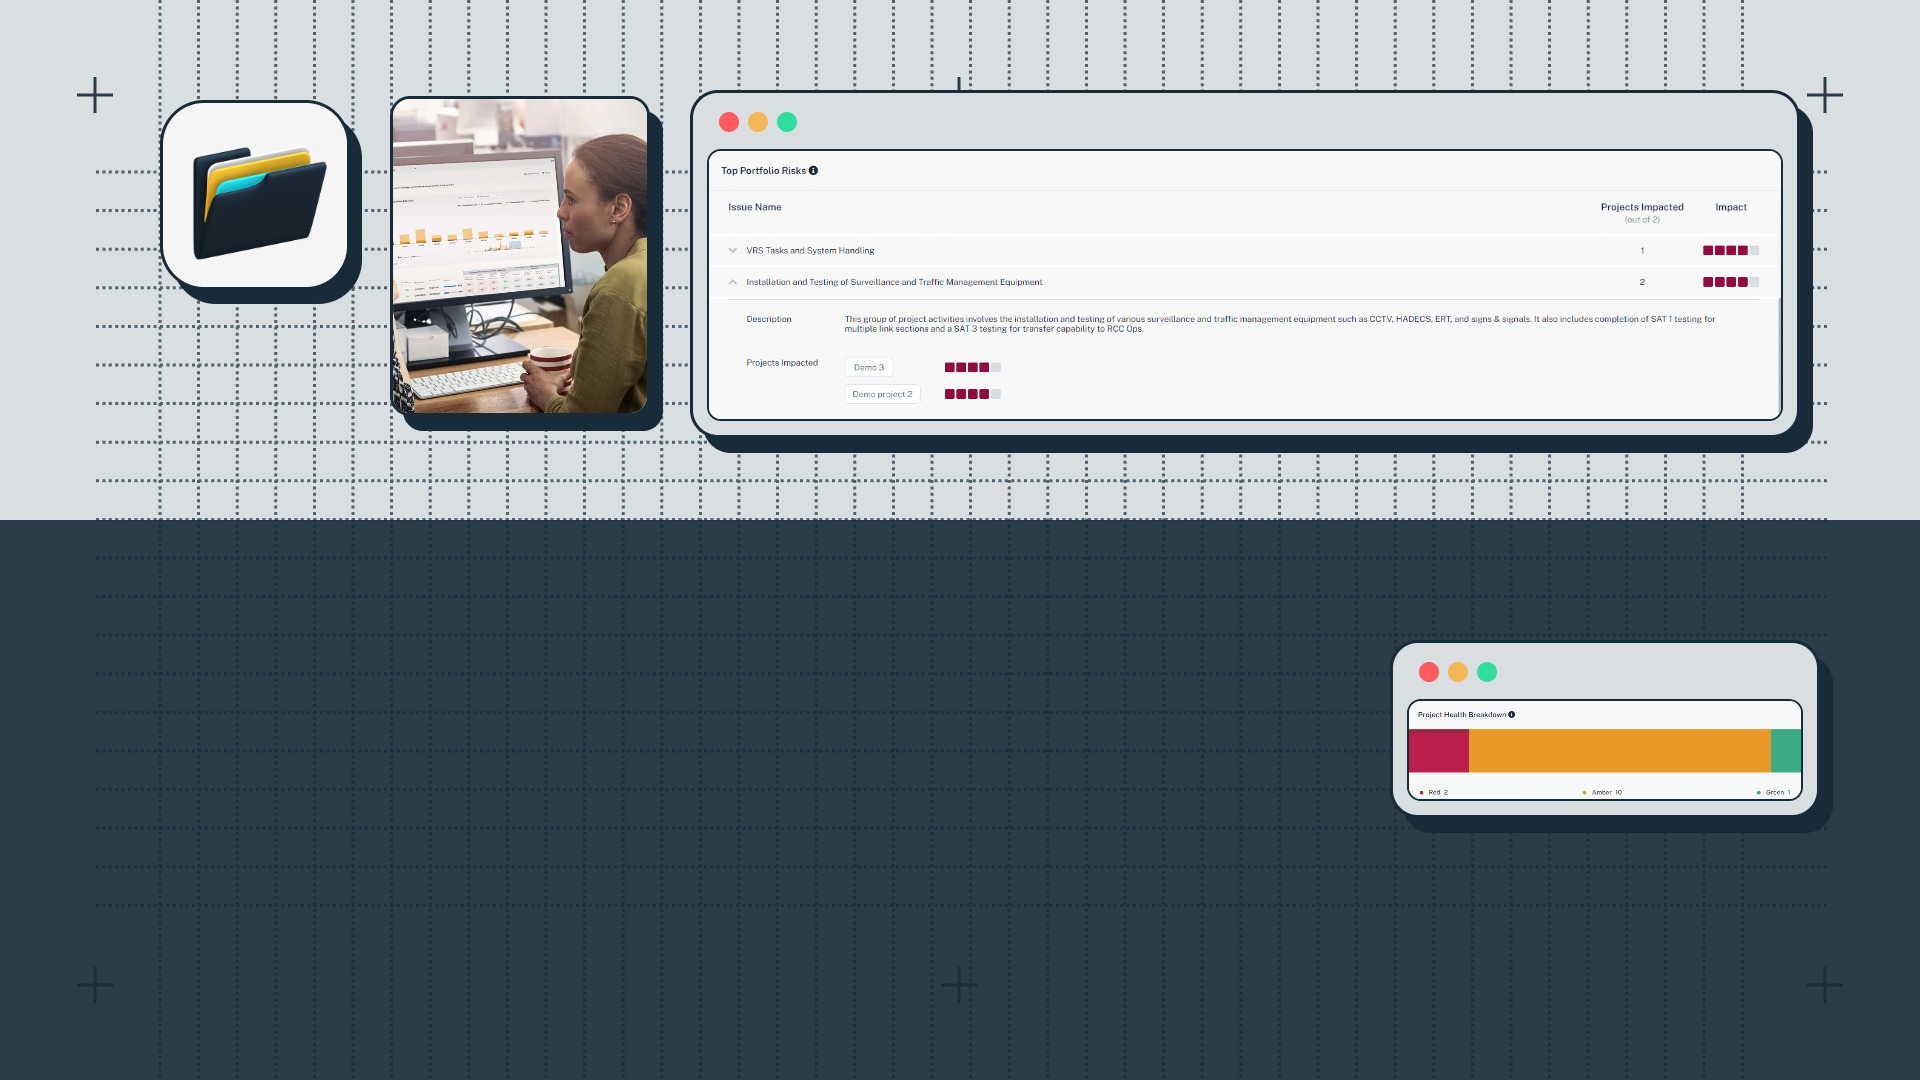
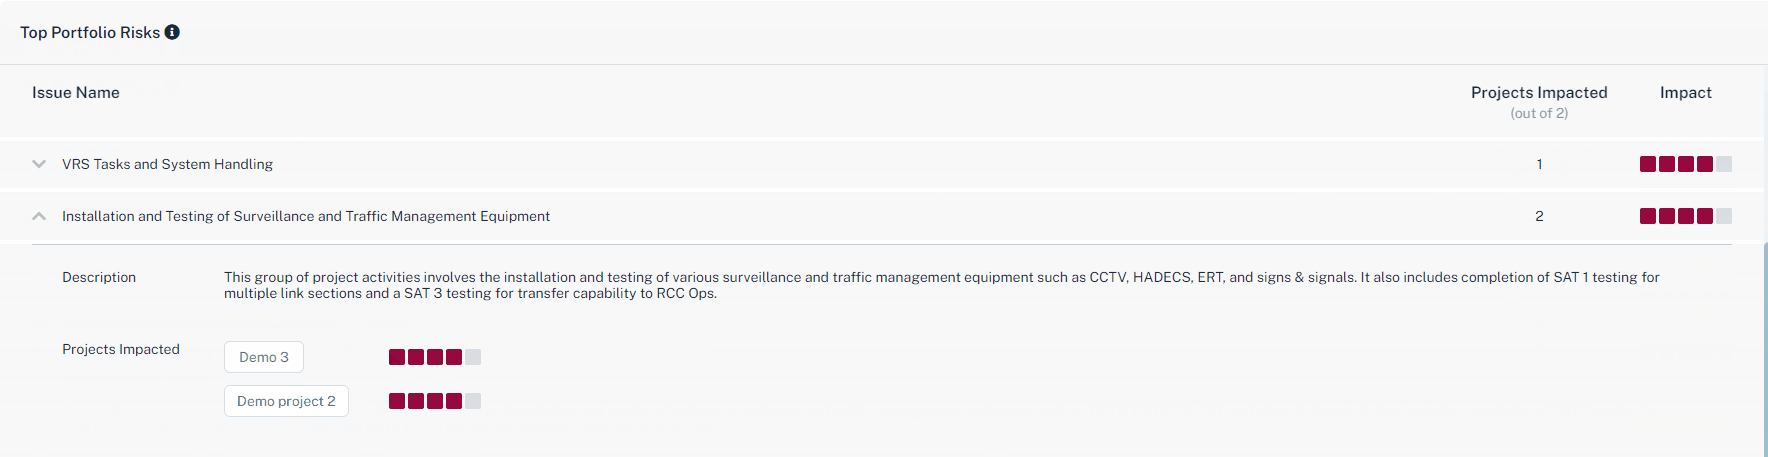
We built nPlan Portfolio so a PMO can read the drivers behind every project's forecast in one place. Its Top Portfolio Risks view lists the issues that recur, with the number of projects each one touches, and the team can see what is driving risk and delay from regions to contractors to key milestones. The forecasts behind it draw on more than 780,000 past project schedules, and teams can label themes, key milestones and KPIs in their own terms, so the whole portfolio reads against one vocabulary.
Portfolio's Top Portfolio Risks view lists each issue with the number of projects it impacts, so a driver that runs through two schemes appears as one row with both projects named (demonstration data).
What records can a PMO check beside the schedules?
Public contract records give a PMO a second view of a contractor's performance on other owners' contracts. They report how a contract went, so they work as a cross-check on a shared driver found in the forecasts, and the forecast remains the place to see what is coming.
United Kingdom
In England, and with some differences in Wales and Northern Ireland, public contracting authorities working under the Procurement Act 2023 generally set at least three key performance indicators for a public contract worth more than £5 million, according to the Cabinet Office's guidance on KPIs. Under the companion guidance on contract performance notices, the authority publishes an assessment against those KPIs at least once every 12 months, rated good, approaching target, requires improvement, inadequate or other, and a separate notice within 30 days when a breach or poor performance meets the Act's tests.
Those notices give a public-sector PMO a published record of a contractor's performance on other authorities' contracts. Private utilities sit outside the KPI requirement for their utilities contracts and outside the breach and poor-performance notices, so the PMO at a privately owned water or network company builds the cross-contract view from its own schedules and contract records. Devolved Welsh contracting authorities follow Welsh-specific guidance on KPIs. Devolved Scottish authorities sit outside the Act and continue under Scottish procurement law, including the Procurement Reform (Scotland) Act 2014, according to the Cabinet Office's guidance on devolved contracting authorities, so a Scottish PMO checks its own rules.
United States
In the United States, federal owners record contractor performance in the Contractor Performance Assessment Reporting System (CPARS), which FAR 42.1502 names as "the Governmentwide evaluation reporting tool". The regulation requires a past performance evaluation for each construction contract of $900,000 or more and each architect-engineer services contract of $45,000 or more, and FAR 42.1503 makes those evaluations available to eligible government officials for authorised purposes, including source selection. A PMO can ask its contracting office which records it may use. State transit agencies, municipal utilities and investor-owned utilities fall outside the FAR, and their PMOs rely on their own contract records and schedules.
How do you choose between project-level and portfolio-level schedule risk software?
Choose by the question the PMO needs answered at each update. Project-level software answers why one project's date is moving and what to do about it. Portfolio-level software answers which projects are most at risk and which drivers recur across them, and it earns its place once the number of live schedules outruns what the team can forecast the same way every cycle.
Project-level and portfolio-level schedule risk software
Question
Project level
Portfolio level
Main question
Why is this date moving, and what helps?
Which schemes are at risk, and which drivers recur?
Main user
Project controls and risk teams
PMO, portfolio and programme directors
Fits when
A few large projects, each with its own risk team
More live schedules than the team can review each cycle
nPlan product
Insights Pro
nPlan Portfolio
Capacity is where the choice tips. Take an illustrative owner with 60 live schemes, updating schedules monthly, and a controls team of four who can each prepare and label forecasts for three schedules a month. That is 12 a month, so each scheme is forecast and labelled about once every five months, and a shared driver cannot be seen across the portfolio at any one update. A portfolio-level forecast on every scheme at every update closes that gap, and the team's time goes to the schemes the shared drivers point to.
The answer changes for a portfolio of a few very large projects. When each project already has its own risk team running a consistent forecast, a monthly cross-read of drivers by the PMO, using the same labels, does the job, and project-level software such as Insights Pro is the investment that pays. A second limit applies at any scale: some shared risks are commercial, such as a contractor's financial position or a decision by its parent company, and no schedule shows them, so the PMO keeps its commercial and supply chain reviews alongside the forecasts.
How should project teams respond to a shared driver?
Once the shared driver is found, each affected scheme still needs its own response. Insights Pro takes the project team from the shared driver to the schedule itself: Driving Paths shows the critical path alongside the sub-critical paths most likely to become critical, and Mitigation Strategies tests the options before the team commits. We cover the single-contractor version of this review in how an owner can assess whether a contractor's completion date is realistic, and Portfolio's forecasts can also feed existing Power BI dashboards.
Back at the illustrative portfolio review, the payoff of finding the shared driver is one decision: a joint recovery plan agreed with one contractor across all three schemes.
Insights Pro · Driving Paths
Trace a shared driver into each affected schedule and see which paths it puts at risk before the next update.
How many schemes does a driver need to appear in before it counts as shared?
Two can be enough when both schemes depend on the same contractor in the same window and one decision would change both. The count matters less than the common lever: three schemes with the same type of work and different contractors may share a market condition, and the PMO's decision is then about sequencing and procurement across the portfolio.
Can a PMO find shared risks with spreadsheets and the monthly reports?
A PMO with a handful of large projects can, provided every schedule is forecast the same way and the drivers are labelled with the same words each month. The method strains as the number of live schedules grows, because the cross-read depends on a few people remembering what they saw in reviews held months apart.
Does a shared contractor risk mean the contractor is performing badly?
A shared driver describes where several forecasts depend on the same contractor, type of work or interface in the same window. It can come from the owner's own sequencing or a busy labour market; any shared crew or plant commitment needs checking with the contractor. Treat it as a capacity and planning question for the owner and the contractor to work through together.
Where does Insights Pro fit if we use nPlan Portfolio?
nPlan Portfolio gives the PMO the portfolio view: early warnings on which parts of the portfolio need attention, the systemic issues behind them and what is driving risk and delay from regions to contractors to key milestones. Insights Pro is for working through one project's schedule in depth: its Driving Paths, the themes driving its forecast and the mitigation options worth testing. The PMO uses Portfolio to find the shared driver and the project team uses Insights Pro to plan the response on each affected scheme.
By clicking “Accept all”, you agree to the storing of cookies on your device to enhance site navigation, analyse site usage, and assist in our marketing efforts. Find more information on our use of cookies here.